
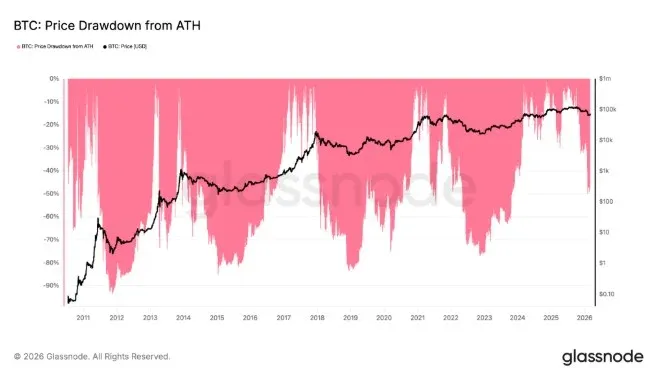
Bitcoin has recently slipped to around $60,000, a range that many analysts view as a potential support zone. Several technical signals suggest that the price could rebound later. Although the current level is still more than 42 % below the all‑time high of $126,000, the technical picture indicates that a new bottom may be forming somewhere between $60,000 and $72,000. The following sections break down the evidence point by point.
In this article we examine four key charts that systematically outline Bitcoin’s recent technical performance. We focus on the double‑bottom pattern, the BTC‑gold ratio, and the re‑testing of a multi‑year trendline. By interpreting these signals, readers can assess whether the market is currently in a bottom‑building phase and glean clues about possible future price paths. The analysis is worth a careful read.
Key Takeaways
- The emergence of a double‑bottom pattern hints at a potential trend reversal.
- The BTC‑to‑gold ratio has retreated to the low of the previous cycle, suggesting a bottom‑formation window that could materialise within weeks.
- Price is once again approaching a historic multi‑year trendline that has historically acted as a market‑bottom reference.
1. Bottom signal from the Bitcoin‑gold ratio
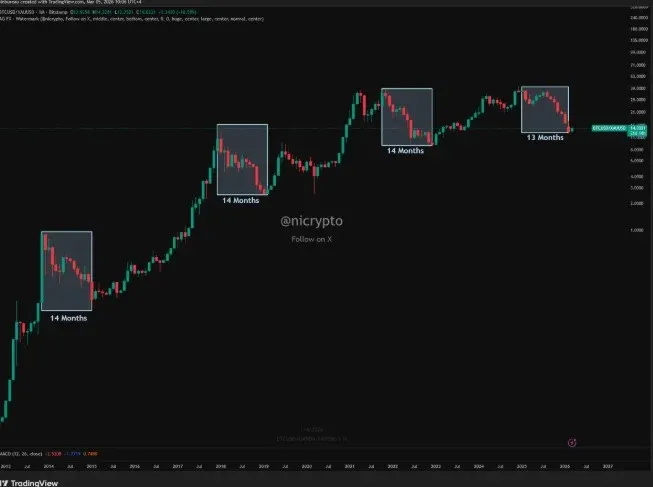
As of March 2024, the BTC‑to‑gold price ratio has been on a downward trajectory for 13 consecutive months, a slide that began from the peak in December 2023. A falling BTC‑gold ratio typically reflects waning investor appetite for risk assets and a shift toward safe‑haven metals such as gold. This shift is often accompanied by macro‑economic uncertainty, heightened geopolitical risk, or tightening liquidity.
Coinbureau CEO Nic noted on X: “In the past three cycles, it has taken roughly 14 months to move from peak to trough, and those timestamps usually coincide with the emergence of a bear‑market bottom.”
When the ratio bottomed at the end of 2022, Bitcoin fell to $15,500 before rallying roughly 352 % to a new high of $73,800 in March 2024. Similar dynamics were observed in 2018 and 2014, where a BTC/XAU trough was followed a year later by Bitcoin gains ranging from 300 % to 450 %. Consequently, we are now in the 13th month of the pull‑back since the last cycle’s peak, suggesting that a bottom could be approaching.
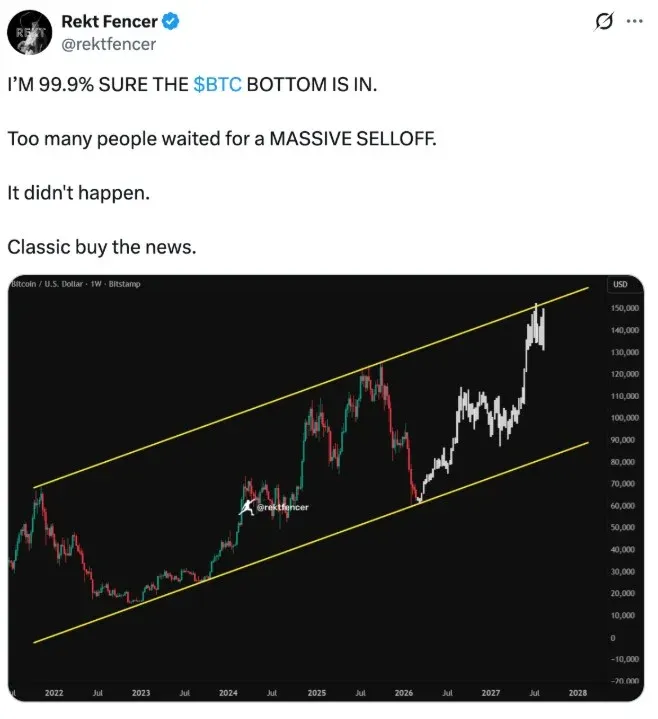
2. Monthly trendline indicating a potential floor
Monthly data on TradingView show Bitcoin re‑testing a long‑standing support trendline that has acted as the floor for previous bear markets in 2018 and 2022. A trader from Coinvo Trading shared a video on X stating: “Bitcoin is closing in on this historic bottom level,” and added: “If history repeats, a breakout could propel the price toward the $500,000 region.”
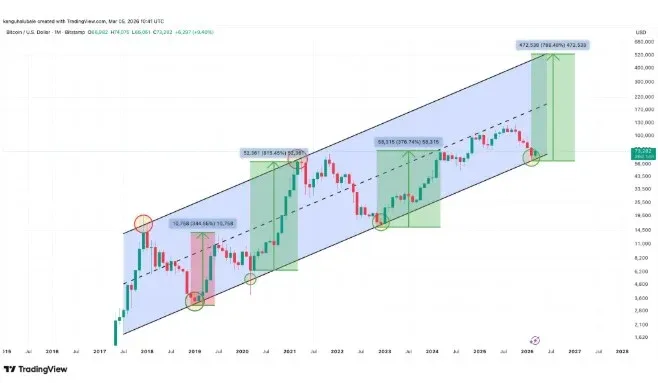
Another analyst, Rekt Fencer, identified a comparable pattern on the weekly chart and argued that after Bitcoin retraced to the 2022 trendline, “the bottom is essentially formed,” reinforcing the earlier assessment.
3. Double‑bottom (“Adam and Eve”) pattern suggesting a reversal
Since February 6, when Bitcoin slid to a multi‑year low of $60,000, the asset rallied about 21 %, reaching a short‑term peak of $74,000 on the 30th before pulling back to $72,500 on Thursday. Crypto analyst Jelle observed that the 12‑hour chart continues to form an “Adam and Eve” double‑bottom—a classic bullish reversal formation that signals diminishing selling pressure.
The chart shows that on Wednesday the price broke above and closed above the “neckline” at $70,000, confirming the pattern. Jelle cautioned: “If bulls cannot hold the breakout zone, a noticeable pull‑back could still occur.”
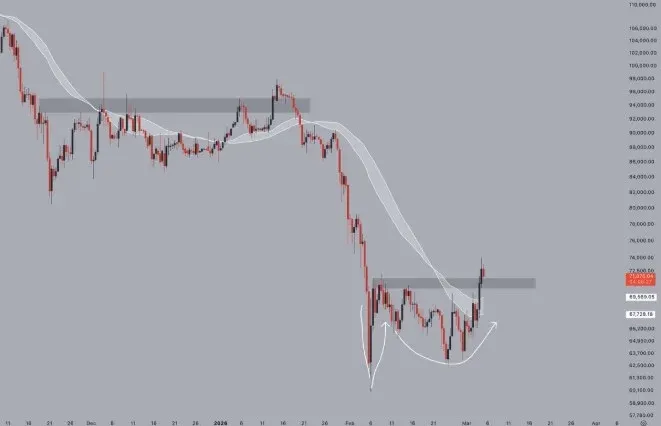
Earlier reporting by Cointelegraph highlighted that a reduction in sell‑side pressure is a prerequisite for Bitcoin to sustain the $70,000 level and confirm a recovery.
4. Additional technical indicators offering support
Beyond the patterns described above, momentum oscillators such as the Relative Strength Index (RSI) are also approaching levels that are typical of a potential bottom, providing further technical backing for a future bounce.
---
The above constitutes a complete, four‑chart‑based analysis of Bitcoin’s current bottom‑building phase. For readers seeking deeper insight into Bitcoin, you can search for prior articles by Bitaigen (比特根) or continue exploring the related links below. Thank you for following Bitaigen’s coverage.
Note for global readers: Fiat transactions are generally processed via SEPA (for Euro‑zone users) or SWIFT for other currencies. U.S. residents should use Binance.US rather than the global Binance platform. Additionally, cryptocurrency gains may be taxable in your jurisdiction; please consult a tax professional to understand your local obligations.
💡 Register on Binance with referral code B2345 for the maximum trading fee discount. See Binance complete guide.


