

This article has been carefully compiled by the Bitaigen editorial team. It examines Bitcoin’s price dynamics during a consolidation phase, dissecting key technical levels, trading volume, and macro‑policy influences. A multi‑dimensional analytical framework is presented to help readers assess whether the market has the momentum to break higher. Please continue reading for a complete perspective.
Bitcoin price forecast
Can Bitcoin break the $70,000 USDT level?
Considering the current technical picture and market sentiment, a move toward the $70,000 USDT target is not impossible, but the probability of achieving it in the short term remains modest.
Technical aspects
- The price is still above the 20‑day moving average (67,685.62 USDT), which acts as a direct support.
- The upper Bollinger Band (71,473 USDT) constitutes the primary resistance. To hold $70,000, Bitcoin must first breach and consolidate above that level.
Influencing factors
| Positive drivers | Risks to watch |
| ---------------- | -------------- |
| Price sits above the 20‑day MA, providing technical support. | MACD remains in negative territory, indicating lingering selling pressure. |
| Large redemption events on exchanges could signal institutional accumulation. | Net outflows from Bitcoin ETFs. |
| The market shows a degree of resilience despite macro‑economic warnings. | Uncertainty around Federal Reserve rate policy, leading to heightened volatility. |
James comments: “The data show upward momentum toward $70,000 exists, but if volume confirmation is not secured near $71,500, the price may continue to oscillate within the current range. A ‘cautiously optimistic’ tone will dominate until a new macro or sector catalyst emerges.” In short, the medium‑term conditions for reaching the target are present, yet the breakthrough of resistance and the return of institutional capital are decisive.
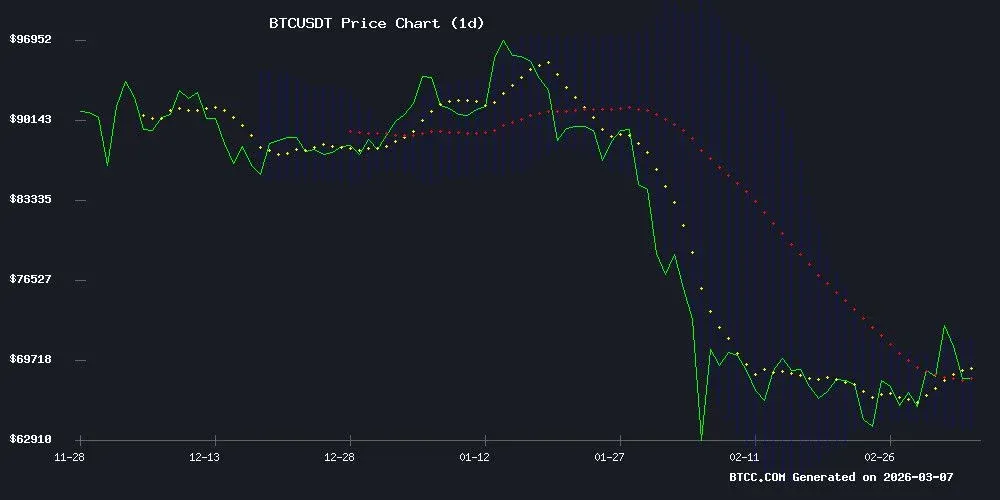
BTC/USDT technical analysis – March 7 2026
As of today, Bitcoin is quoted at 67,845.06 USDT, slightly above the 20‑day moving average (67,685.62), indicating a solid technical support level. The MACD is still in negative territory (‑897.90), but the signal line (411.07) suggests that selling pressure may be easing. The Bollinger Band range spans 63,898.20 USDT (lower band) to 71,473.04 USDT (upper band), with the current price hugging the middle band. Analyst James from BTCC explains: “Bitcoin is currently consolidating above a key moving average. If it can stay above 68,000 USDT, it is likely to edge toward the upper Bollinger Band—around the $71,500 USDT mark.”
Market sentiment: Maintaining cautious optimism amid volatility
Recent headlines indicate that the market is still searching for direction. USDT encounters resistance near the $73,000 level, and large redemption flows on exchanges hint at long‑term capital accumulation. However, sizable outflows from ETF funds and macro‑economic warnings offset this bullish signal. James assesses: “The debate over a ‘bull market trap’ versus a ‘cycle restart’ mirrors the split in market opinion. With Federal Reserve rate uncertainty, price resilience is commendable, yet volatility has clearly risen again.” Overall sentiment leans toward cautious optimism, with participants closely monitoring institutional flows and macro data releases.
Key factors and recent events
1. What lies behind Bitcoin’s approach to the $73,000 threshold?
Swissblock analysts argue that unless the critical resistance is broken, the current rally may be a fleeting illusion. Momentum has rebounded from deep negative territory, a pattern historically associated with regime changes. The +0.5 resistance level is especially pivotal; holding it would boost the credibility of further upside. Although ETF inflows and on‑chain metrics have improved, CryptoQuant’s bull‑market score remains at 10 / 100, indicating a fragile recovery.
2. Large‑scale Bitcoin withdrawals draw attention
On March 4 2026, roughly 32,000 BTC (valued at $2.26 billion) were transferred out of a Bitfinex wallet, marking the biggest single‑day withdrawal since June 2025. Chain analysts note that movements of this magnitude typically signal institutional buyers moving Bitcoin into cold storage. Weekly withdrawal volume reached 47,700 BTC, a new annual high. When stablecoin prices approach $70,000, large inflows suggest heightened spot‑market activity, yet the ultimate destination of these funds remains to be seen.
3. Bond market warnings and risk‑asset performance
Amid a broader rebound in risk assets, Bitcoin has stayed above the $70,000 mark and posted a near‑10 % gain after a week of geopolitical turbulence, mirroring gains in S&P 500 futures. Conversely, the bond market has moved in the opposite direction. Expectations of a Fed rate cut have faded, with the probability dropping from 80 % to below 50 %. Oil prices edging toward $82 per barrel could reignite inflation concerns, constraining central‑bank policy space. The March 17 meeting is not expected to produce any policy shift, leaving markets wary of a potential policy vacuum.
4. Bitcoin and equities find support at key psychological levels
Recently, Bitcoin has consistently traded above $70,000, while the S&P 500 has reclaimed some lost ground. Yet, U.S. Treasury yields have risen for four consecutive days, suggesting that energy shocks and inflation pressures may prolong the Federal Reserve’s hawkish stance. This week Bitcoin rebounded roughly 6 % to $70,500, demonstrating modest resilience. Earlier oil‑price swings had driven Bitcoin down to about $63,000 before a swift recovery, underscoring the elasticity of risk assets under macro shocks.
5. The controversy surrounding a brief surge to $74,000
Bitcoin briefly spiked to $74,000, sparking a split among observers. Optimists claim the market has bottomed and entered a new upward phase, while skeptics point to a striking resemblance to the pre‑crash pattern of 2022, when Bitcoin fell roughly 60 % after a 140‑day local peak. Technical analyst Isaiah warns: “This could be a sign of a local top,” and cautions that a break below $68,000 might trigger algorithmic sell‑offs. Nonetheless, open interest and institutional accumulation indicate that underlying strength may still be present.
6. Paraguay plans to convert seized mining rigs into fiscal revenue
The Paraguayan government, together with the national power authority (ANDE), intends to deploy 30,000 confiscated ASIC miners at the Itaipú hydroelectric plant’s surplus capacity for Bitcoin mining. The project is projected to generate about $240 million per year by 2025, turning hardware assets into state revenue. Observers view this as a pragmatic reuse of seized equipment—similar to converting confiscated sports cars into police vehicles—rather than letting them sit idle.
7. Outflows from Bitcoin spot ETFs
On March 5, Bitcoin spot ETFs recorded a net daily outflow of $227.9 million, the most severe since the $410 million plunge on February 12. The large sell‑off caused Bitcoin to briefly rebound to near $73,000 before slipping below $70,000, exposing market fragility. However, smoothed flow data over the past 14 days show that selling pressure has eased, and a tentative stabilization could signal institutional buying, laying groundwork for future upside.
8. Oil price hikes and macro uncertainty amplify Bitcoin volatility
Rising global oil prices and heightened geopolitical tension have once again heightened Bitcoin’s volatility, pushing the price below the $70,000 threshold and highlighting its sensitivity to macro factors. Blockchain data reveal an acceleration of transfers from long‑term holding wallets to exchanges, suggesting potential selling pressure. Although ETF inflows remain positive, broader financial‑market turbulence could still impact Bitcoin’s trajectory.
Conclusion
In summary, the technical picture shows Bitcoin still consolidating above a key support zone. If volume confirmation is achieved around the $71,500 USDT level, a breakout past the $70,000 target appears feasible. Nevertheless, macro‑economic conditions, interest‑rate outlooks, and institutional capital flows remain uncertain and could keep the price oscillating within a range. Market participants should keep a close eye on critical resistance levels, institutional activity, and policy developments to make more reasoned decisions amid volatility.
This content is provided for reference only. For additional Bitcoin price forecasts, please search for previous Bitaigen articles or continue browsing the related links below. Thank you for your support!
*Note for U.S. readers: when accessing cryptocurrency exchanges, use Binance.US rather than the global Binance platform. Transfers involving fiat should follow SEPA or SWIFT procedures where applicable.*
💡 Register on Binance with referral code B2345 for the maximum trading fee discount. See Binance complete guide.


