

Recent multiple technical signals suggest that Bitcoin has retreated to the $60,000 range, potentially providing a buying window for the next upward move.
In this article we systematically dissect Bitcoin’s recent price‑bottom characteristics from four critical dimensions—double‑bottom pattern, BTC‑gold ratio, long‑term trend line, and other technical indicators. Through chart comparisons and technical interpretation, we aim to help readers spot a potential buying window. Subsequent sections will expand on the details, so please continue reading.
Key Takeaways
- A double‑bottom formation has emerged, hinting that the market may be shifting from decline to rise.
- The BTC‑gold ratio is once again approaching its previous low, signalling a short‑term bottom.
- Price is closing in on a multi‑year trend line that historically marked previous lows.
BTC‑Gold Ratio Sends Another Bottom Signal
As of March 2024, the BTC‑to‑gold ratio has been on a downward trajectory for 13 consecutive months, pulling back from its December 2024 peak. A declining ratio typically indicates that investors’ demand for Bitcoin as a hedge is weakening, with a pivot toward gold. This reflects concerns about macro‑economic uncertainty, geopolitical risk, or tightening liquidity.
Nic Carter, founder of Coinbureau, noted on X that the last three cycles each took roughly 14 months to fall from peak to trough, adding:
“These cycles line up with bear‑market bottoms.”
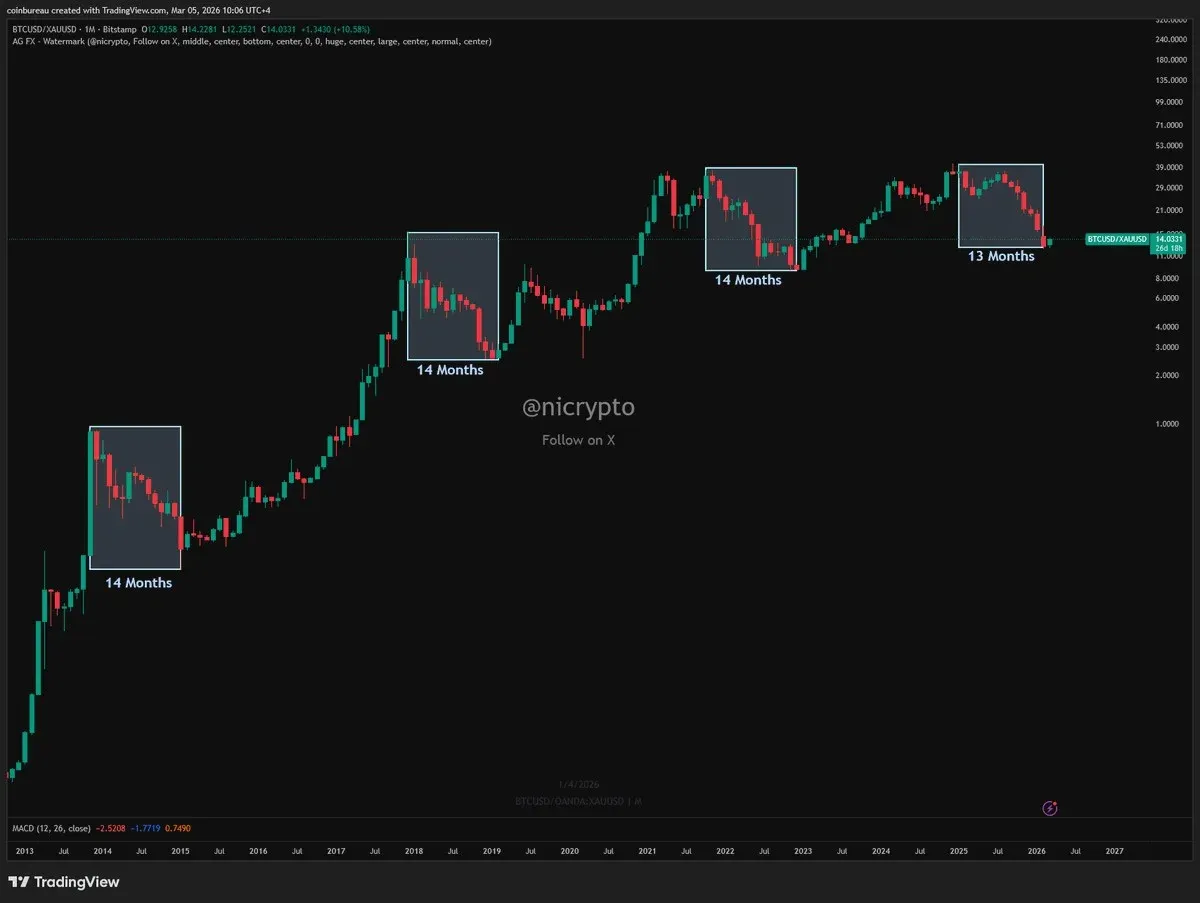
After Bitcoin hit a macro‑low of $15,500 at the end of 2022, it surged 352 % to set an all‑time high of $73,800 in March 2024. Similar patterns occurred in 2018 and 2014—approximately one year after the Bitcoin‑gold ratio hit its trough, the price rallied 300 %–450 %. Therefore, the current 13‑month pullback could be foreshadowing an imminent bottom.
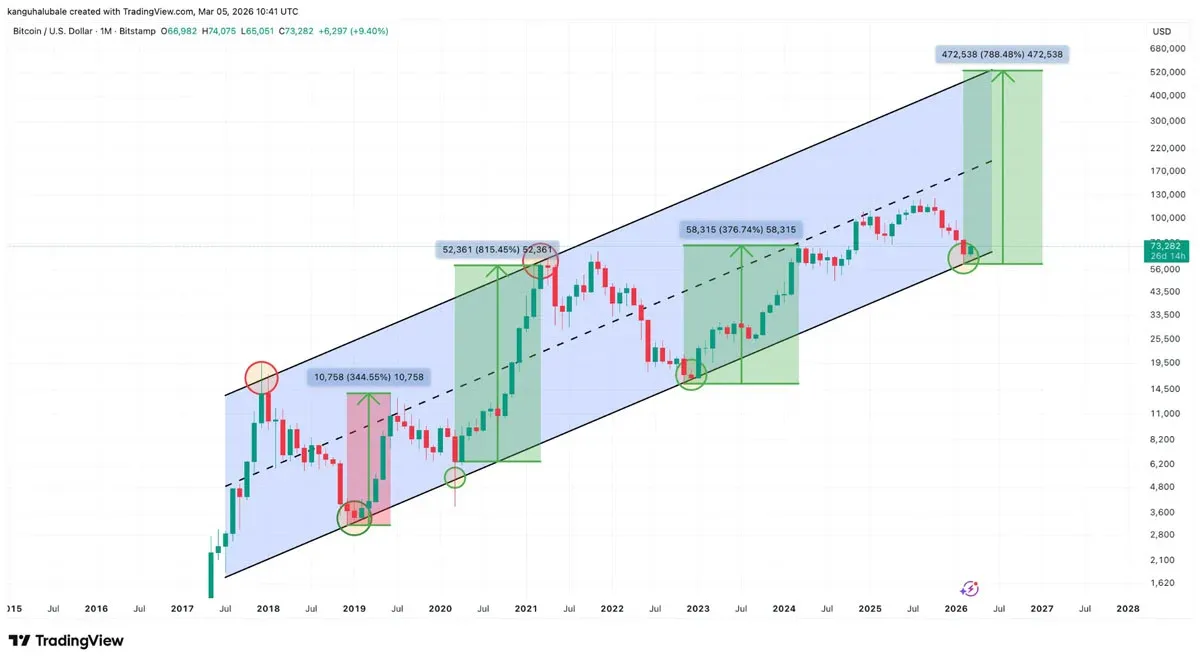
Multi‑Year Trend Line Suggests Cyclical Bottom
TradingView data shows Bitcoin’s monthly chart is once again approaching a long‑term support trend line. This line acted as a crucial bottom during the bear markets of 2018 and 2022.
An analyst from Coinvo Trading mentioned in an X video: “Bitcoin is now near the bottom level of this historic trend line,” and added:
“If history repeats, Bitcoin will test this line again and ultimately cap near $500,000.”
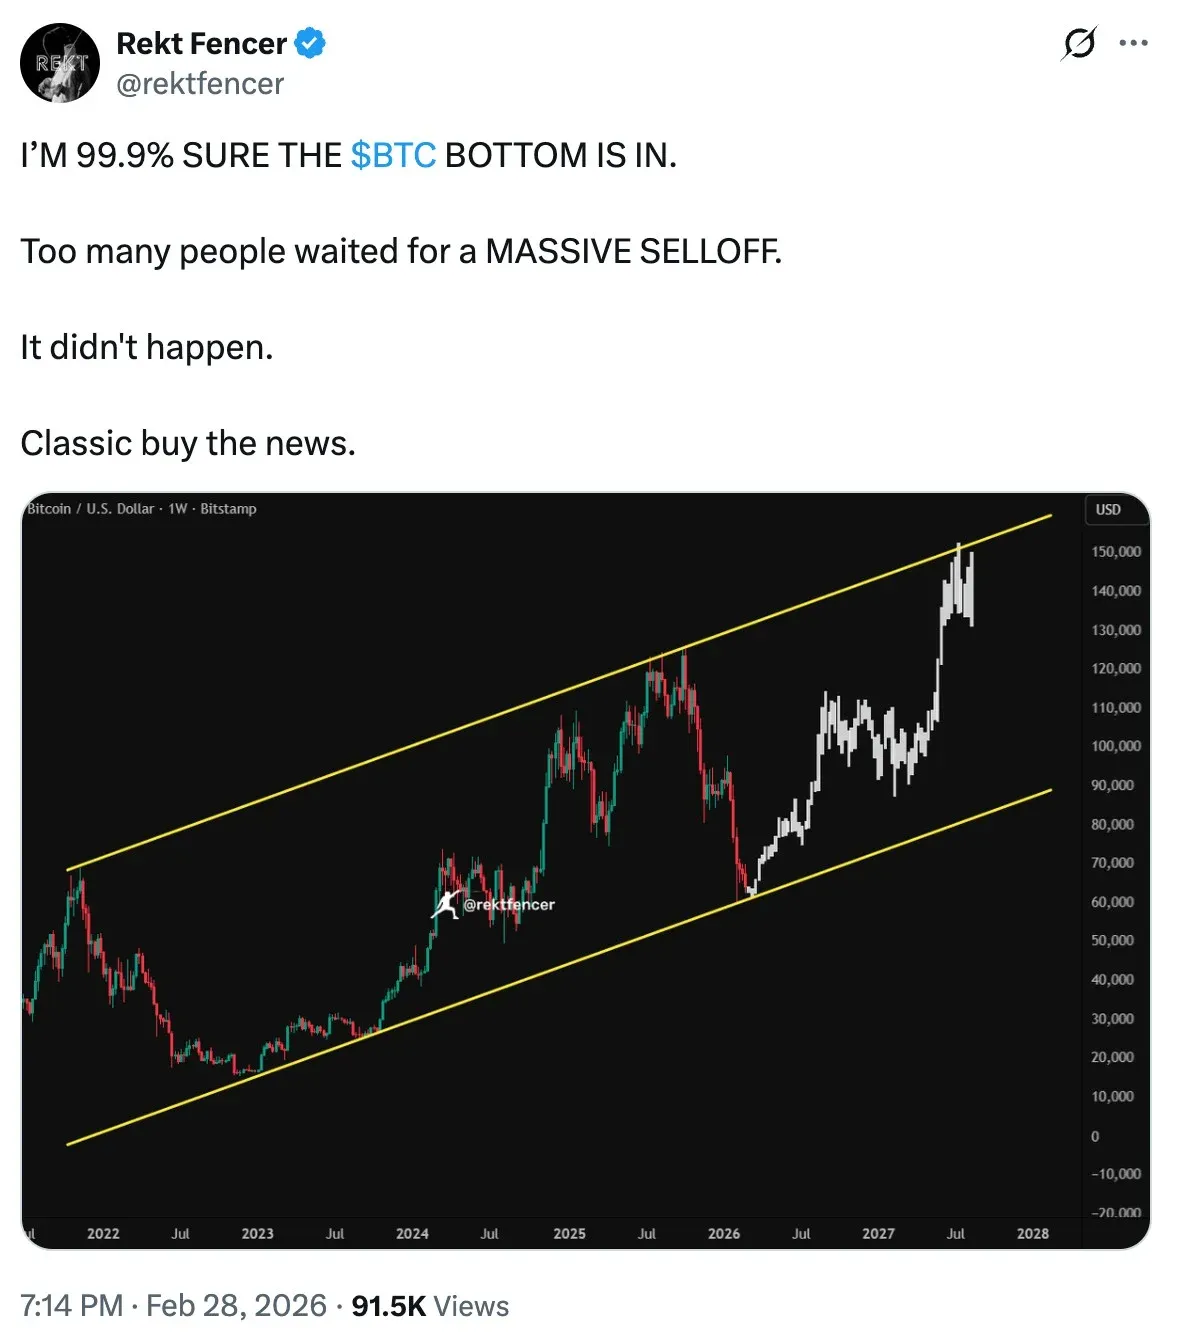
Another analyst, Rekt Fencer, observed a similar signal on the weekly chart this week, insisting that a Bitcoin bottom has already formed and noting that price is retesting the trend line that marked the 2022 low.
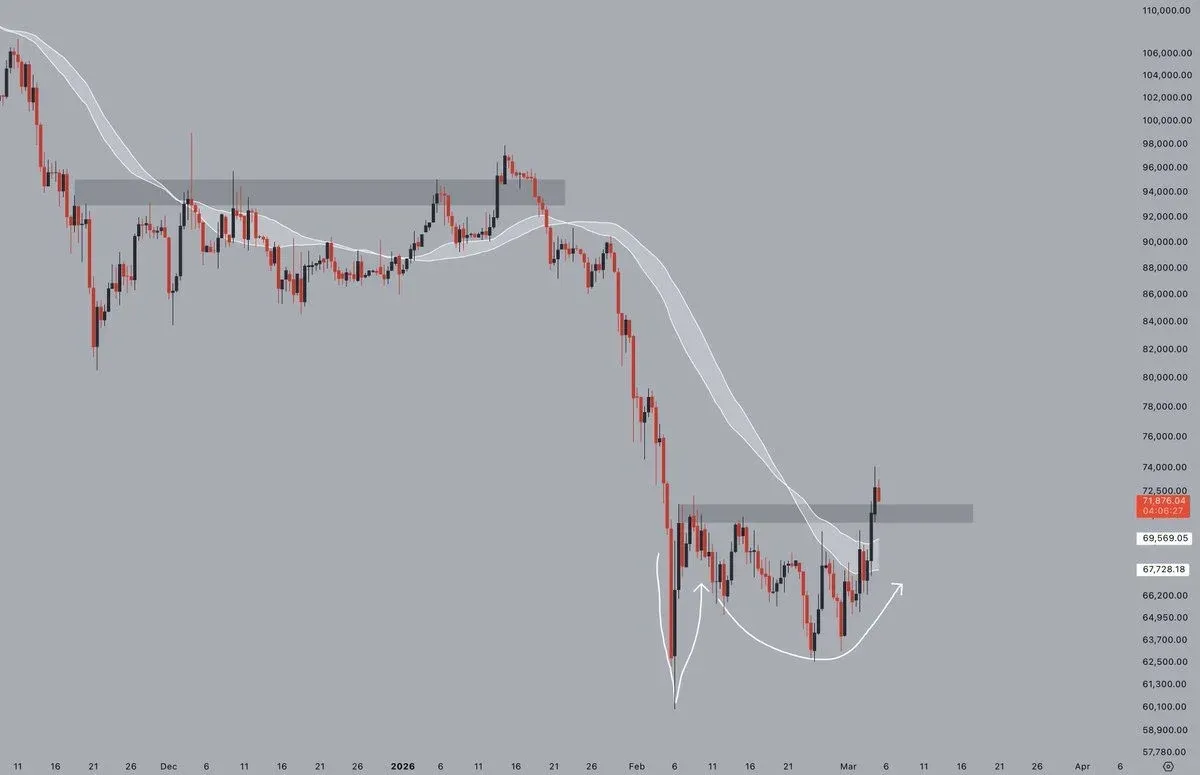
Double‑Bottom Pattern Points to Trend Reversal
Since dropping to a multi‑year low of $60,000 on February 6, Bitcoin has recovered about 21 %, reaching a high of $74,000 on the 30th before slipping back to $72,5 00 on Thursday. Crypto analyst Jelle believes the 12‑hour chart still displays an “Adam‑and‑Eve bottom” formation.
The Adam‑and‑Eve bottom is a bullish reversal pattern—a variant of the classic double bottom—appearing at the end of a downtrend and suggesting that selling pressure may be waning.
Related coverage: Bitcoin’s bull‑market momentum is accelerating, but breaking the $78,000 barrier remains challenging.
A confirmation would require price to close above $70,000 on Wednesday and break the “neckline” (the peak between the two lows). Analysts caution that bulls must hold the breakout zone; otherwise, a noticeable retracement could re‑emerge.
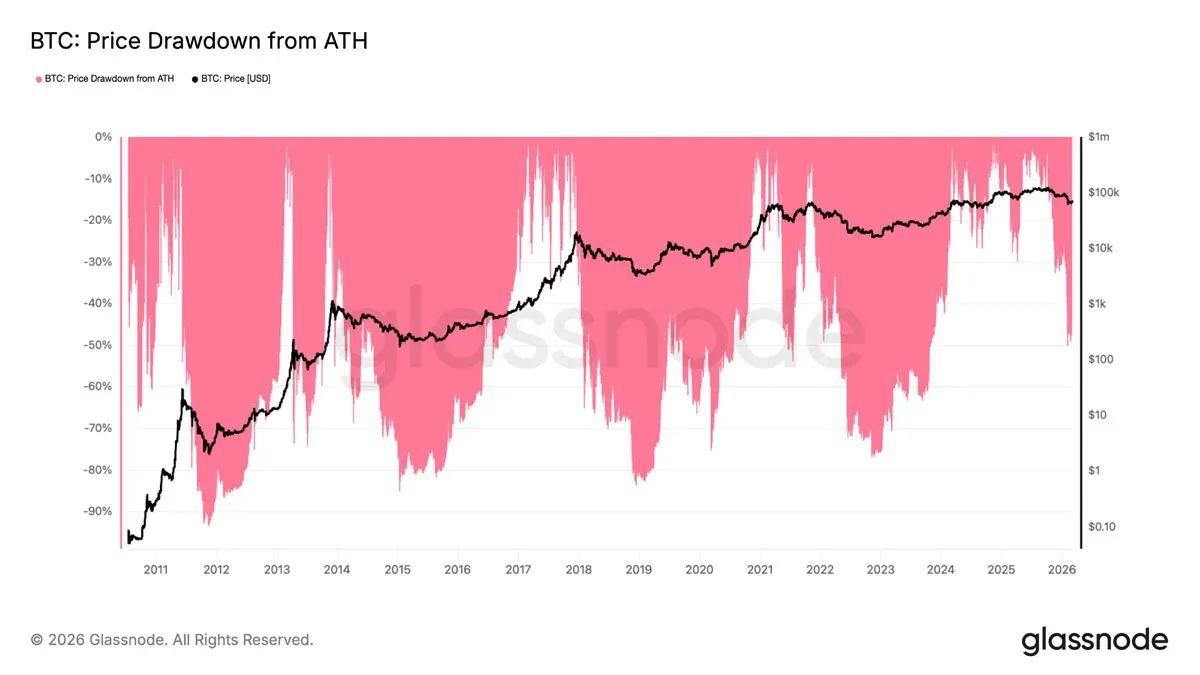
BTC: Price decline from historic highs. Source: Glassnode
Summary
Looking at four dimensions—double‑bottom formation, BTC‑gold ratio, long‑term trend line, and technical indicators such as RSI—Bitcoin appears to be edging toward a potential bottom. For more in‑depth coverage of the four‑chart analysis of Bitcoin’s price‑bottom features, follow the upcoming articles from Bitaigen (比特根).
Note for U.S. readers: If you intend to purchase Bitcoin, consider using Binance.US, the regulated U.S. platform, rather than the global Binance site. For fiat deposits and withdrawals outside the U.S., SEPA and SWIFT are the standard channels.
*Crypto gains may be taxable in your jurisdiction; consult a tax professional for guidance.*
💡 Register on Binance with referral code B2345 for the maximum trading fee discount. See Binance complete guide.


