
In this article we outline how the market structure has changed after Bitcoin slipped below a key price level, focusing on the motivations behind large‑holder sell‑offs and retail investors’ contrarian accumulation. We also combine ETF fund flow data and sentiment indices to present the multiple signals behind the current downtrend. To learn about possible future scenarios, please continue reading.

Recently, Bitcoin’s price has retreated to roughly $68,000 (according to CoinMarketCap data). At the same time the Fear & Greed Index fell from 18 on the previous trading day to 12, entering the “extreme fear” zone. In parallel, U.S. spot Bitcoin ETFs recorded their largest net outflow since February 12, with 11 funds withdrawing a total of about $348.9 million (Farside data).
Divergent Actions of Whales and Retail Participants
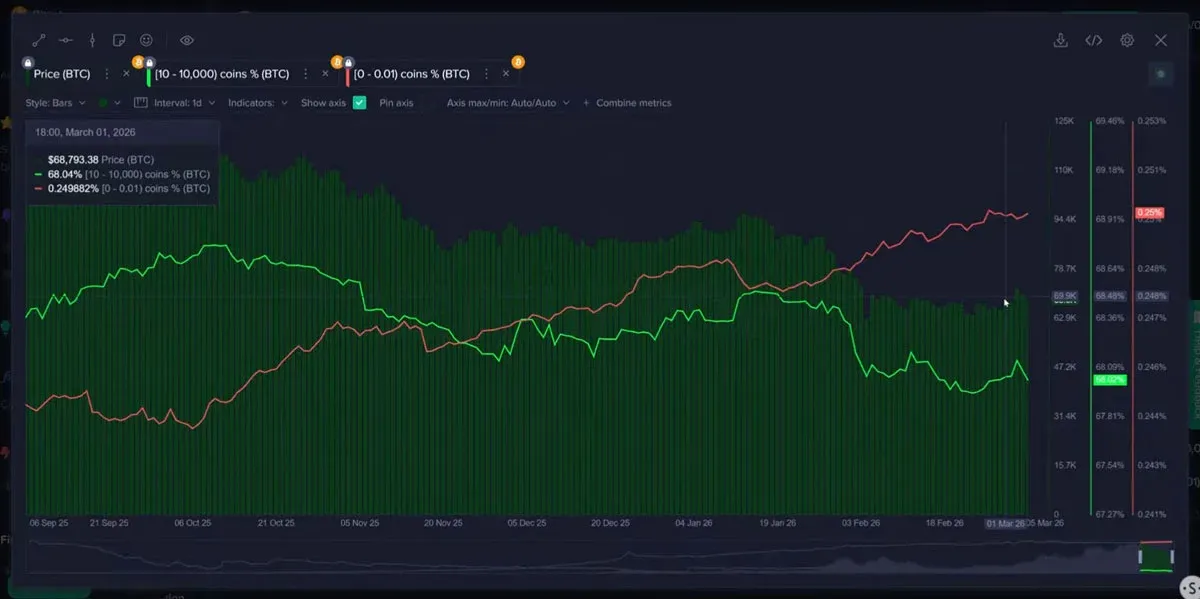
Santiment’s latest report shows that after Bitcoin surged past $70,000 on Wednesday and briefly touched $74,000, addresses holding a large amount of BTC—commonly referred to as “whales” (balances between 10,000 – 100,000 BTC)—have sold roughly 66 % of the volume they acquired in the recent buying wave. In the chart, the whale‑selling trend is highlighted with a green line, while the continued buying by scattered investors (balances below 0.01 BTC) is shown with a red line, creating a stark visual contrast.
The report further notes that “when Bitcoin’s price approached $74,000, these key holders began to take profits.” In fact, whales had previously amassed a sizable portion of the circulating supply between February 23 and March 3, when trading ranged between $62,900 – $69,600.
Retail Buying Has Not Reversed the Overall Correction
Santiment argues that “when retail inflows occur while whales are simultaneously unloading, it usually indicates that the market correction is still underway.” Data reveal that, although retail investors holding less than 0.01 BTC have increased their positions recently, overall sell pressure remains dominant. Michael van de Poppe, founder of MN Trading Capital, added on X (formerly Twitter): *“If Bitcoin cannot hold the $67,000 – $68,000 band, it is likely to test low‑liquidity zones in the short term before seeking any rebound opportunities.”*
Academic Views on Price Levels and the Bottom
Economist Timothy Peterson posted on X that “a valuation around $60,000 already represents the bottom range for Bitcoin, with roughly a 99.5 % probability of staying above that level.” His view is based on the Metcalfe‑value model for Bitcoin and incorporates the price trajectory from the October all‑time high of $126,000 down to $60,000.
Summary
Taking into account the sizable whale sell‑offs, the limited buying power of retail participants, and the continued outflow from ETF funds, the market still faces downward pressure in the near term. Should Bitcoin fail to establish solid support within the $67,000 – $68,000 corridor, prices may continue to oscillate in the lower range until new buying momentum emerges. For further analysis of Bitcoin’s behavior after breaking the $70,000 mark, stay tuned to Bitaigen’s (比特根) upcoming reports.
Note: For users in the United States, trading on the global Binance platform is not available; you must use Binance.US or another regulated U.S. exchange. When converting fiat, SEPA (for euros) or SWIFT (for USD and other currencies) are the typical cross‑border transfer methods. Additionally, please be aware that cryptocurrency gains may be subject to taxation in your local jurisdiction, so consider consulting a tax professional.
💡 Register on Binance with referral code B2345 for the maximum trading fee discount. See Binance complete guide.


